You can add a chart or graph in a Google Docs document from Google Sheets by opening the Docs file, choosing the spot for the chart, clicking Insert > Chart > Google Sheets > selecting the file and choosing Select > then clicking the chart and choosing Import.
While Google Docs and Google Sheets are popular because they are good, free, and reliable, the fact that they are both browser-based is really helpful.
Not only can you access them from almost any computer or phone, but you can access your files almost anywhere that you have an Internet connection.
Our tutorial below will show you how to insert a graph in Google Docs by adding it from a Google Sheets file that you have saved to your Google Drive cloud storage.
Summary – How to Insert a Google Sheets Chart Into a Google Docs Document
- Open your Google Docs file.
- Click where you want the chart.
- Select the Insert tab.
- Choose Chart, then Google Sheets.
- Select the Sheets file, then click Select.
- Choose the chart, then click Import.
Our guide continues below with additional information on how to insert a graph in Google Docs, including pictures of these steps.
There are a lot of benefits to using the Google Drive suite of applications.
They are accessible from basically any computer with an Internet connection; you can share and collaborate with other Google users, you can do things like create newsletters from a library of templates, and you get a very capable set of programs, for free, that can let you do much of what Microsoft Office provides.
But one other benefit of the Google apps is how well they integrate with one another.
If you have a Google Sheets file that contains a chart or graph that would be beneficial to a document you are creating, then you are able to add that chart or graph to the document. You can even change the margins in Google Docs if the inserted chart is too large for the document.
Our guide below will show you how to insert your chart.
Our Google Sheets text wrapping guide can show you how to format your text so that it’s easier to read inside of your cells.
How to Insert Existing Chart Into Google Docs (Guide with Pictures)
The steps in this article were performed in the desktop version of the Google Chrome Web browser. You can also do this in other desktop browsers like Safari or Firefox. If you haven’t yet created a Google Sheets chart, this article can show you how.
Step 1: Sign into your Google Drive at https://drive.google.com and open the Docs file into which you wish to add the chart.
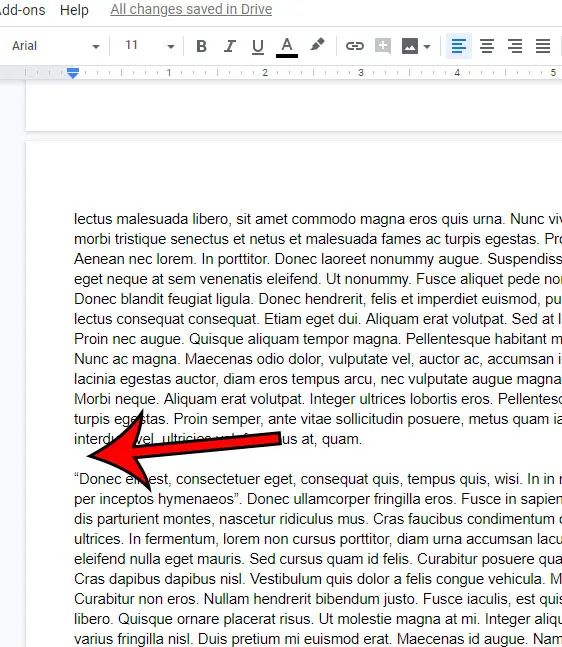
Step 2: Click at the point in the document where you wish to add the chart.
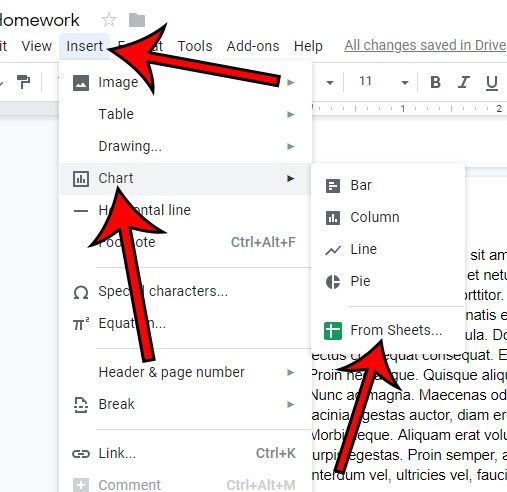
Step 3: Select the Insert tab at the top of the window, choose the Chart option, then select Google Sheets.
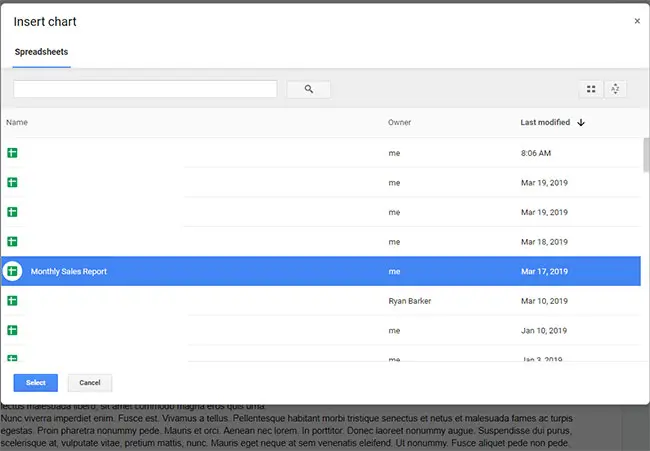
Step 4: Choose the Sheets file containing the chart to add, then click the Select button.
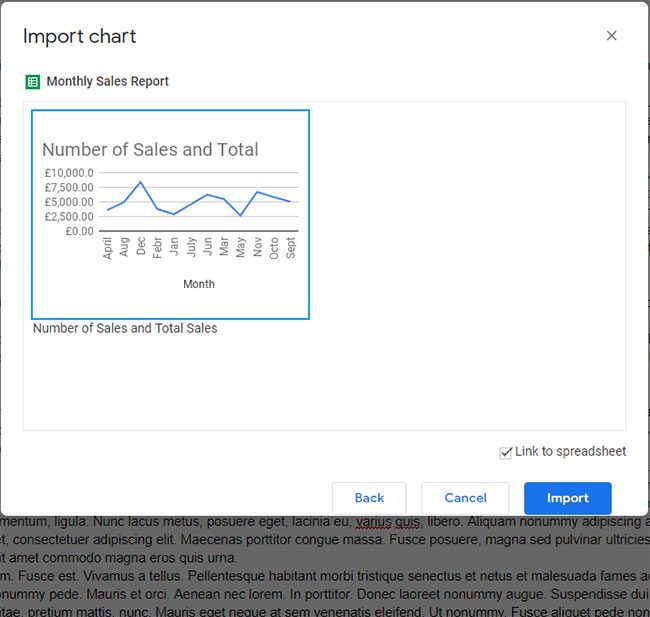
Step 5: Select the chart to add, choose whether to include a link to the spreadsheet, then click the Import button.
Now that you know how to insert a graph in Google Docs, you will be able to follow these steps any time that a document you are editing would benefit from the inclusion of a chart or graph that you have previously created in one of your spreadsheets.
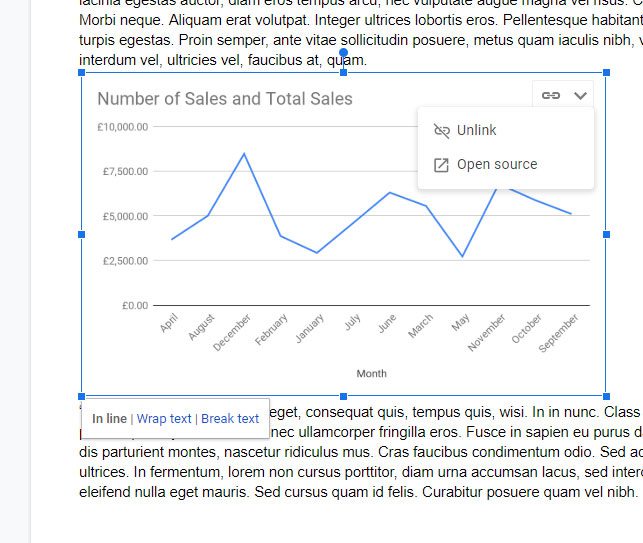
Note that you can resize the chart using the handles along the border.
Additionally, when the chart is selected, there will be a link icon at the top-right. If you select that, you can choose to unlink the spreadsheet or open it instead.
If you need to add some data to your document but don’t have an existing chart, then find out about adding tables in Google Docs for a way to add some well-structured data to your document.
You can also check out our how to insert text box in Google Docs article if you have been having trouble finding that option in the word processing application.
What Are Some Reasons to Include a Google Sheets Chart in a Google Docs Document?
Integrating Google Sheets charts into Google Docs pages can boost the quality and impact of your reports, presentations, and collaborative publications dramatically. Here are numerous convincing reasons to include Google Sheets charts in your Google Docs document:
Charts provide a visual representation of data, making complex information more accessible and understandable. Charts may help your audience absorb information at a glance, whether you’re providing financial statistics, project schedules, or survey results.
Data Interpretation: Charts allow you to present data in a way that makes it easier to interpret. You can emphasize trends, patterns, and connections in the data, allowing readers to derive important insights without delving into raw figures.
Visual content, such as charts and graphs, has been shown to interest readers more successfully than plain text. They break up the monotony of text-heavy documents and make the content more visually appealing, grabbing and retaining the attention of your readers.
Data Validation: Including charts from Google Sheets in your Google Docs document aids with data validation. Transparency is provided by visibly presenting the source of your data, which is very crucial in corporate reports and research papers.
If the data in your Google Sheets chart is susceptible to change, embedding it in Google Docs ensures that the chart updates in real-time as you make changes in the attached spreadsheet. This saves you the time and work of manually updating charts whenever data changes.
Collaboration: Because Google Docs and Google Sheets are part of the same set of applications, collaboration is simple. By embedding a Google Sheets chart into a Google Docs document, your team can simply access and debate the chart from a single spot, facilitating collaboration.
Google Sheets provides a variety of chart styles and customization options, allowing you to personalize the visual representation to your individual needs. You can select among bar charts, line charts, pie charts, and more, and customize the colors, names, and scales to match the design of your document.
Data Drill-Down: For readers who wish to go deeper into the data, Google Docs charts have the ability to click and access the related Google Sheets page. This allows for a more in-depth degree of analysis for those who need it while keeping the primary document succinct.
Consistency: By embedding charts directly from Google Sheets, you keep your data source and display consistent. Any modifications made to the source document are reflected in the embedded chart, lowering the possibility of data discrepancies.
Export and Print: You can simply export or print Google Docs pages, allowing you to share or show your material in a variety of ways. The embedded charts are preserved, ensuring that the visual representation of your data remains consistent regardless of distribution method.
Charts can help increase document accessibility by providing an alternative approach to present information to people who have trouble comprehending huge amounts of text. Charts may be interpreted by screen readers and other assistive technology, making your material more inclusive.
Professionalism: Including well-designed and informative charts in your publications indicates professionalism and attention to detail. It demonstrates that you have thought about how to convey your data simply and effectively, which increases your trust.
Finally, including Google Sheets charts in your Google Docs pages is a fantastic method to improve your content’s presentation, comprehension, and engagement. Charts are a visually appealing and effective way of delivering complex data and insights to your audience, whether you’re working on commercial reports, academic papers, or collaborative projects. This integration not only makes the presentation process easier, but it also improves the overall quality and impact of your documents.

Matthew Burleigh has been writing tech tutorials since 2008. His writing has appeared on dozens of different websites and been read over 50 million times.
After receiving his Bachelor’s and Master’s degrees in Computer Science he spent several years working in IT management for small businesses. However, he now works full time writing content online and creating websites.
His main writing topics include iPhones, Microsoft Office, Google Apps, Android, and Photoshop, but he has also written about many other tech topics as well.