Google Sheets is a great alternative to Microsoft Excel, and provides you with many of the tools that make Excel such an appealing application. One of these tools allows you to create a graph or chart to provide a visual representation of your data.
But you may find that the chart or graph you create isn’t as helpful as you had thought or, even worse, it might actually be confusing to the people that are viewing the spreadsheet. Luckily the charts and graphs that you create in Google Sheets aren’t permanent, so you’re able to delete ones that you no longer want or need.
How to Remove a Google Sheets Graph or Chart
The steps in this article were performed in the desktop version of the Google Chrome Web browser. Once you complete the steps in this article, the chart or graph will be removed from the file. If you decide later that you want the chart or graph, you can always restore an old version of the file to get it back.
Step 1: Sign into your Google Drive at https://drive.google.com and open the file containing the chart or graph you want to delete.
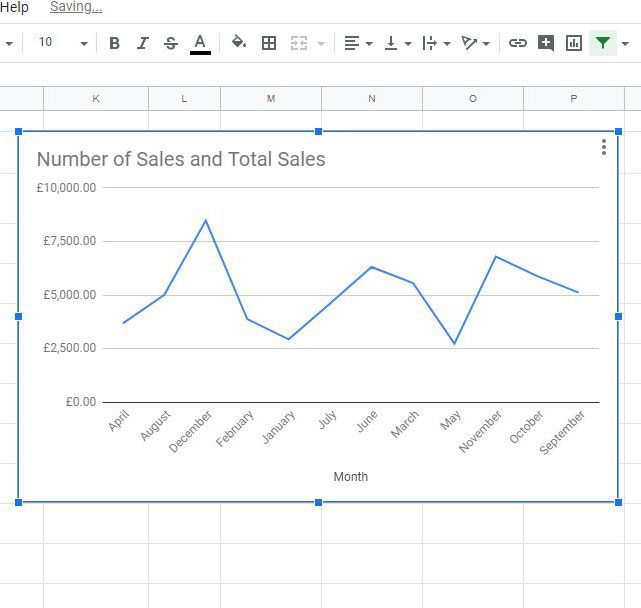
Step 2: Click on the object to select it.

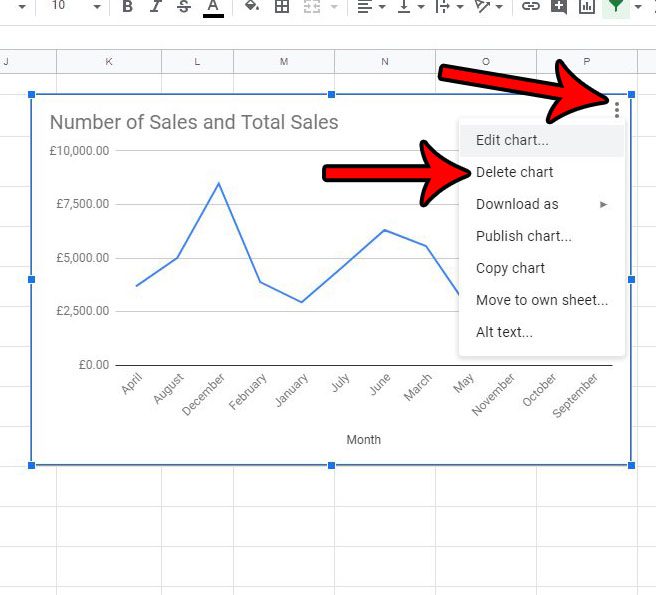
Step 3: Click the three dots at the top right of the chart or graph, then choose the Delete chart option.

Now that you know how to delete a chart or graph in Google Sheets, you can easily remove unwanted objects from your spreadsheets.
If you’ve decided to keep your chart or graph, there is more that you can do with it than simply include it with your spreadsheet. Find out how to insert a Google Sheets chart in a Google Docs file, for example, if you’ve created a document that could benefit from the inclusion of your chart.
Continue Reading
- How to merge cells in Google Sheets
- How to wrap text in Google Sheets
- How to alphabetize in Google Sheets
- How to subtract in Google Sheets
- How to change row height in Google Sheets

Matthew Burleigh has been writing tech tutorials since 2008. His writing has appeared on dozens of different websites and been read over 50 million times.
After receiving his Bachelor’s and Master’s degrees in Computer Science he spent several years working in IT management for small businesses. However, he now works full time writing content online and creating websites.
His main writing topics include iPhones, Microsoft Office, Google Apps, Android, and Photoshop, but he has also written about many other tech topics as well.