If you spend a lot of time creating, editing, and formatting data in Microsoft Excel, then you might choose to create a chart that presents that data in a format that is easier to understand. But you might need to show that chart in another file format, or online, leaving you looking for a way to save your chart as a picture from Excel 2010.
While Excel 2010’s default use is as a means for storing, sorting and comparing data, there are many other functions that it can perform admirably. One function for which it is very useful is creating charts from specific ranges of data that you have entered into a spreadsheet or workbook. This allows you to create a visual representation of your data that can make it simpler for your audience to understand all of the information that you are presenting to them.
But if you just want to share a chart that you have created, you might think that you need to share the entire Excel file. Fortunately, it is possible to save an Excel 2010 chart as a JPG file, which gives you a lot of freedom concerning ways that the chart can then be used.
How to Save a Chart as a Picture in Excel 2010
- Right-click on the chart, then click Copy.
- Open an image-editing program, like Microsoft Paint.
- Press Ctrl + V on your keyboard, or right-click on the canvas to paste the image.
- Click the Save button.
- Select an image format, such as JPEG or PNG, then click the Save button.
Our article continues below with another way to save a chart as an image, including pictures of those steps.
How to Save a Chart as an Image By Copying and Pasting Into Paint from Excel 2010 (guide with Pictures)
While there are simple ways to copy and paste data between different Microsoft Office programs, there are certain ways that they can work together that you may not have considered. For example, it is possible to create a chart in Excel from a certain range of data, then you can create a JPG image from that data which can be inserted into a Powerpoint presentation or a Word document. So continue reading below to learn the process necessary to save your chart as a picture.
Step 1: Open the Excel workbook containing the chart which you want to save as a JPEG picture.
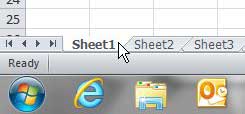
Step 2: Click the tab for the sheet at the bottom of the window that contains the chart.
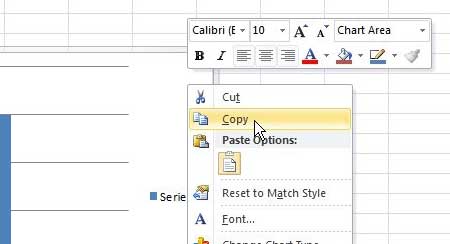
Step 3: Right-click the chart, then click Copy.
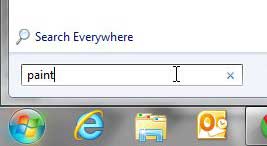
Step 4: Click the Start button at the bottom-left corner of your screen, click inside the search box, type paint, then press Enter on your keyboard.
The screenshot below was performed in Windows 7 but will also work in Windows 10.
Step 5: Press Ctrl + V on your keyboard to paste the copied chart onto the canvas.
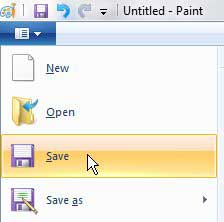
Step 6: Click the Paint tab at the top-left corner of the window, then click the Save option.
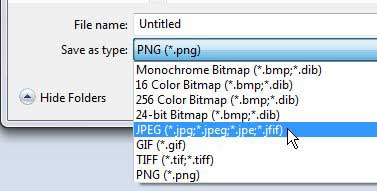
Step 7: Click the drop-down menu to the right of Save as type, then click the JPEG option.
Note that you can also choose other popular picture file types, such as the Portable Network Graphics Format (PNG format) if you need your file to be in that format instead.
Step 8: Choose a location on your computer for the JPEG file, type a name for the file into the File name field, then click the Save button.
This method is only necessary if you are working in Microsoft Excel 2010. If you are using a newer version of Excel, such as the most recent Office 365 version, then you will have a simpler option that we outline below.
Can I Save Excel Charts as an Image File from My Excel File?
While you can quickly copy an Excel chart from Excel 2010 and paste it into another application, you will need to use an image editing application like Microsoft Paint or Adobe Photoshop to create a file in an image format for that chart.
However, there is an option that appears on the Excel shortcut menu for a chart in newer versions of Excel, and it makes it much simpler to create common image files.
The steps to save Excel chart image files are discussed in the next section.
How to Save a Chart as a Picture from Excel for Office 365
- Open the Excel file.
- Select the chart.
- Right-click on the chart and choose Save as Picture.
- Give the chart a name, select the file type, then click Save.
For more information on working with Excel charts as image files, continue reading below.
More Information on How to Save an Excel Chart as an Image in Excel 2010
One of the best parts about working with multiple Microsoft Office applications is that they integrate in helpful ways. One of these involves adding an Excel chart to a document in Microsoft Word or Microsoft Powerpoint. If you copy the chart from Excel, then open your Word document you will see a “Paste” button on the Home tab. If you click that button you will have a number of different options for how to paste into the Word document, including:
- Use Destination Theme & Embed Workbook
- Keep Source Formatting & Embed Workbook
- Use Destination Theme & Link Data
- Keep Source Formatting & Link Data
- Picture
Which of the above options you choose will depend on your needs, but they all offer useful methods of copying an Excel chart directly into a Word document.
If you are using a newer version of Microsoft Excel, such as Excel 2013, Excel 2016, or Excel for Office 365 then you have the “Save as Picture” option when you right-click your chart. You will also have the ability to select the type of image file that you want to save to. These file types include:
- Portrable Network Graphics (.png)
- JPEG File Interchange Format (.jpeg)
- Graphics Interchange Format (.gif)
- Tag Image File Format (.tiff)
- Windows Bitmap (.bmp)
- Scalable Vector Graphics (.svg)
All of these image formats can be useful in the right situation and offer different capabilities depending on how you need to use the chart image.
One other option you might consider if you need to save multiple charts, or charts from an entire workbook, is to save your Excel file as a Web page. You can do this by clicking the File tab at the top-left of the window, then choosing Save As and selecting the “Save as Web Page” option from the file type dropdown menu.
This is going to place image files of all the charts into a folder with the Web page file and is an efficient option when you need to save charts and use them in another way.
Now that you have created the JPEG file, you will be able to use it at any point in the future when you want to insert the chart into a document or presentation.
Additional Sources

Matthew Burleigh has been writing tech tutorials since 2008. His writing has appeared on dozens of different websites and been read over 50 million times.
After receiving his Bachelor’s and Master’s degrees in Computer Science he spent several years working in IT management for small businesses. However, he now works full time writing content online and creating websites.
His main writing topics include iPhones, Microsoft Office, Google Apps, Android, and Photoshop, but he has also written about many other tech topics as well.
